.
Our electricity-generating systems are in the process of being overhauled. It is very much a case of out with the old and in with the new as the OECD turns its back on coal. The OECD envisions decarbonizing electricity generation using a combination of wind power, solar power, and biomass instead. Focusing on CO2 intensity alone has led to a number of bizarre outcomes such as transporting wood pellets from North America to Europe for industrial-scale power generation; covering hilltops with wind turbines; and fields with solar panels. It is difficult to find an environmental reason in these measures.
Researchers at ETH Zurich wanted to develop a more holistic approach to characterize various generating technologies, but they were confronted with a challenge. How does one compare nuclear power with wind and coal power? This is like comparing apples with barley and potatoes. Multi-criteria decision analysis offered researchers a means of quantifying all of the relevant information for the task. They began with the three pillars of sustainable development:
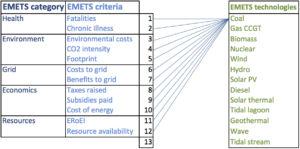 Table 1 Energy Matters Electricity Technology Survey (EMETS) design showing 5 categories and 12 criteria against which 13 technologies were measured. The example shows how 12 criteria may be applied to coal, but may equally be applied to gas, biomass, etc.
*ERoEI (energy return on energy invested), is a measure of efficiency and considers the full energy production cycle.
In conventional MCDA, stakeholders are often asked to express a preference at the criteria level. The approach researchers adopted was rather different. They sought, instead, to assign scores to each criterion where a 1 = good and a 10 = bad. For example, low fatalities, low CO2 and high availability are all regarded as “good.” Nineteen participants, mainly engineers, physicists, geologists and geophysicists assigned scores, using professional judgement and not preference as a guide. The results, summarized in Figure 1, show 13 technologies in rank order based on total mean scores.
Table 1 Energy Matters Electricity Technology Survey (EMETS) design showing 5 categories and 12 criteria against which 13 technologies were measured. The example shows how 12 criteria may be applied to coal, but may equally be applied to gas, biomass, etc.
*ERoEI (energy return on energy invested), is a measure of efficiency and considers the full energy production cycle.
In conventional MCDA, stakeholders are often asked to express a preference at the criteria level. The approach researchers adopted was rather different. They sought, instead, to assign scores to each criterion where a 1 = good and a 10 = bad. For example, low fatalities, low CO2 and high availability are all regarded as “good.” Nineteen participants, mainly engineers, physicists, geologists and geophysicists assigned scores, using professional judgement and not preference as a guide. The results, summarized in Figure 1, show 13 technologies in rank order based on total mean scores.
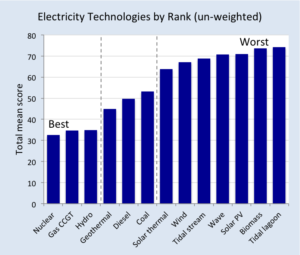 Figure 1 Thirteen electricity technologies arranged in rank order according to their total mean MCDA score selects 3 clear winners - nuclear power, combined cycle gas, and hydroelectric power. Outright losers include all of the new renewable technologies. In the middle, Geothermal and diesel, both niche technologies, and coal - cheap, abundant and controllable - are down-rated on health and environmental grounds.
In order to display results for individual technologies, researchers developed a 12-axis spider diagram (see Figure 2). The spider diagram for nuclear power shows that it scored well on all criteria and that is why it emerged, albeit narrowly, as the top technology. Hydroelectric power displays an uneven distribution on criteria scores. It has performed less well on resource availability, because most good hydroelectric sites are already in use and less well on environmental costs and environmental footprint since hydro reservoirs destroy natural habitats and occupy a substantial area.
The spider diagrams for gas and coal (top right Figure 2) shows how each perform well in the Resources, Economics, and Grid categories and less well in the Health and Environmental categories. Unsurprisingly, coal performs particularly poorly in terms of health and environment. The diagram highlights the similarities and differences between gas and coal. The slightly poor performance of gas in the Health and Environment categories is offset, however, by good performance in the Resources, Economics and Grid categories resulting in a total mean score that is comparable to nuclear and hydroelectric power.
Figure 1 Thirteen electricity technologies arranged in rank order according to their total mean MCDA score selects 3 clear winners - nuclear power, combined cycle gas, and hydroelectric power. Outright losers include all of the new renewable technologies. In the middle, Geothermal and diesel, both niche technologies, and coal - cheap, abundant and controllable - are down-rated on health and environmental grounds.
In order to display results for individual technologies, researchers developed a 12-axis spider diagram (see Figure 2). The spider diagram for nuclear power shows that it scored well on all criteria and that is why it emerged, albeit narrowly, as the top technology. Hydroelectric power displays an uneven distribution on criteria scores. It has performed less well on resource availability, because most good hydroelectric sites are already in use and less well on environmental costs and environmental footprint since hydro reservoirs destroy natural habitats and occupy a substantial area.
The spider diagrams for gas and coal (top right Figure 2) shows how each perform well in the Resources, Economics, and Grid categories and less well in the Health and Environmental categories. Unsurprisingly, coal performs particularly poorly in terms of health and environment. The diagram highlights the similarities and differences between gas and coal. The slightly poor performance of gas in the Health and Environment categories is offset, however, by good performance in the Resources, Economics and Grid categories resulting in a total mean score that is comparable to nuclear and hydroelectric power.
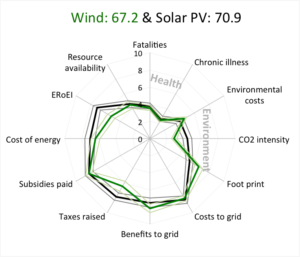
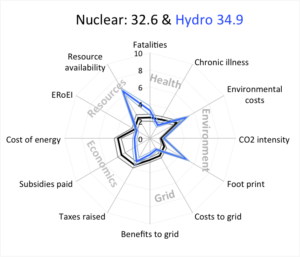
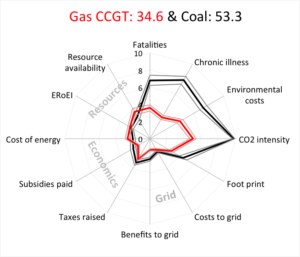 Figure 2 Spider diagrams for 6 out of 13 technologies surveyed. Researchers developed a 12-axis spider diagram, one axis for each criterion scaled from zero in the center to 10 at the circumference. The ideal electricity source would be represented by a circle with a radius of 1 (the best score in each category). The axes are arranged according to hierarchy. The total mean scores are shown in the panel headers.
Wind and solar photovoltaic systems have similar shapes in the diagram, performing well in Health and Environment and poorly in Resources, Economics and Grid categories. This shape is common to all of the non-combustion, renewable technologies including wave, tidal, and solar thermal energy. The wind and solar spider diagrams are effectively a mirror image of coal.
To sum up, the structured, hierarchical MCDA provided researchers with a means of comparing and quantifying electricity generation technologies. Their survey of 13 technologies sampling expert opinion produced three clear winners, namely nuclear power, combined cycle gas turbine, and hydroelectric power. This should come as no surprise to anyone since these technologies are already widely deployed, known to be among the safest available, and already proven to work together to provide a stable and reliable grid at low cost. What is less easy to explain is why countries like Germany, Switzerland and France have plans to close down their nuclear power stations and replace them with wind and/or solar power that the survey suggests are vastly inferior, at least compared with the present available technologies.
About the authors: Dr. Euan Mearns has a PhD in isotope geochemistry. A former academic, businessman, investor, consultant and energy blogger, he has been employed as a Senior Researcher at ETH Zurich since January 2018. Dr. Didier Sornette is Professor on the Chair of Entrepreneurial Risks at ETH Zurich since 2006 in the department of Management, Technology and Economics, and a professor at the Swiss Finance Institute. Sornette is also associated with both the departments of Physics and of Earth Sciences at ETH Zurich.
Figure 2 Spider diagrams for 6 out of 13 technologies surveyed. Researchers developed a 12-axis spider diagram, one axis for each criterion scaled from zero in the center to 10 at the circumference. The ideal electricity source would be represented by a circle with a radius of 1 (the best score in each category). The axes are arranged according to hierarchy. The total mean scores are shown in the panel headers.
Wind and solar photovoltaic systems have similar shapes in the diagram, performing well in Health and Environment and poorly in Resources, Economics and Grid categories. This shape is common to all of the non-combustion, renewable technologies including wave, tidal, and solar thermal energy. The wind and solar spider diagrams are effectively a mirror image of coal.
To sum up, the structured, hierarchical MCDA provided researchers with a means of comparing and quantifying electricity generation technologies. Their survey of 13 technologies sampling expert opinion produced three clear winners, namely nuclear power, combined cycle gas turbine, and hydroelectric power. This should come as no surprise to anyone since these technologies are already widely deployed, known to be among the safest available, and already proven to work together to provide a stable and reliable grid at low cost. What is less easy to explain is why countries like Germany, Switzerland and France have plans to close down their nuclear power stations and replace them with wind and/or solar power that the survey suggests are vastly inferior, at least compared with the present available technologies.
About the authors: Dr. Euan Mearns has a PhD in isotope geochemistry. A former academic, businessman, investor, consultant and energy blogger, he has been employed as a Senior Researcher at ETH Zurich since January 2018. Dr. Didier Sornette is Professor on the Chair of Entrepreneurial Risks at ETH Zurich since 2006 in the department of Management, Technology and Economics, and a professor at the Swiss Finance Institute. Sornette is also associated with both the departments of Physics and of Earth Sciences at ETH Zurich.
- Environment
- Economy
- Society
- Class 1: Electricity that is produced when we want to use it.
- Class 2: Electricity that is produced when we do not want to use it.
- Class 3: Electricity that is not produced when we want to use it.
 Table 1 Energy Matters Electricity Technology Survey (EMETS) design showing 5 categories and 12 criteria against which 13 technologies were measured. The example shows how 12 criteria may be applied to coal, but may equally be applied to gas, biomass, etc.
*ERoEI (energy return on energy invested), is a measure of efficiency and considers the full energy production cycle.
In conventional MCDA, stakeholders are often asked to express a preference at the criteria level. The approach researchers adopted was rather different. They sought, instead, to assign scores to each criterion where a 1 = good and a 10 = bad. For example, low fatalities, low CO2 and high availability are all regarded as “good.” Nineteen participants, mainly engineers, physicists, geologists and geophysicists assigned scores, using professional judgement and not preference as a guide. The results, summarized in Figure 1, show 13 technologies in rank order based on total mean scores.
Table 1 Energy Matters Electricity Technology Survey (EMETS) design showing 5 categories and 12 criteria against which 13 technologies were measured. The example shows how 12 criteria may be applied to coal, but may equally be applied to gas, biomass, etc.
*ERoEI (energy return on energy invested), is a measure of efficiency and considers the full energy production cycle.
In conventional MCDA, stakeholders are often asked to express a preference at the criteria level. The approach researchers adopted was rather different. They sought, instead, to assign scores to each criterion where a 1 = good and a 10 = bad. For example, low fatalities, low CO2 and high availability are all regarded as “good.” Nineteen participants, mainly engineers, physicists, geologists and geophysicists assigned scores, using professional judgement and not preference as a guide. The results, summarized in Figure 1, show 13 technologies in rank order based on total mean scores.
 Figure 1 Thirteen electricity technologies arranged in rank order according to their total mean MCDA score selects 3 clear winners - nuclear power, combined cycle gas, and hydroelectric power. Outright losers include all of the new renewable technologies. In the middle, Geothermal and diesel, both niche technologies, and coal - cheap, abundant and controllable - are down-rated on health and environmental grounds.
In order to display results for individual technologies, researchers developed a 12-axis spider diagram (see Figure 2). The spider diagram for nuclear power shows that it scored well on all criteria and that is why it emerged, albeit narrowly, as the top technology. Hydroelectric power displays an uneven distribution on criteria scores. It has performed less well on resource availability, because most good hydroelectric sites are already in use and less well on environmental costs and environmental footprint since hydro reservoirs destroy natural habitats and occupy a substantial area.
The spider diagrams for gas and coal (top right Figure 2) shows how each perform well in the Resources, Economics, and Grid categories and less well in the Health and Environmental categories. Unsurprisingly, coal performs particularly poorly in terms of health and environment. The diagram highlights the similarities and differences between gas and coal. The slightly poor performance of gas in the Health and Environment categories is offset, however, by good performance in the Resources, Economics and Grid categories resulting in a total mean score that is comparable to nuclear and hydroelectric power.
Figure 1 Thirteen electricity technologies arranged in rank order according to their total mean MCDA score selects 3 clear winners - nuclear power, combined cycle gas, and hydroelectric power. Outright losers include all of the new renewable technologies. In the middle, Geothermal and diesel, both niche technologies, and coal - cheap, abundant and controllable - are down-rated on health and environmental grounds.
In order to display results for individual technologies, researchers developed a 12-axis spider diagram (see Figure 2). The spider diagram for nuclear power shows that it scored well on all criteria and that is why it emerged, albeit narrowly, as the top technology. Hydroelectric power displays an uneven distribution on criteria scores. It has performed less well on resource availability, because most good hydroelectric sites are already in use and less well on environmental costs and environmental footprint since hydro reservoirs destroy natural habitats and occupy a substantial area.
The spider diagrams for gas and coal (top right Figure 2) shows how each perform well in the Resources, Economics, and Grid categories and less well in the Health and Environmental categories. Unsurprisingly, coal performs particularly poorly in terms of health and environment. The diagram highlights the similarities and differences between gas and coal. The slightly poor performance of gas in the Health and Environment categories is offset, however, by good performance in the Resources, Economics and Grid categories resulting in a total mean score that is comparable to nuclear and hydroelectric power.

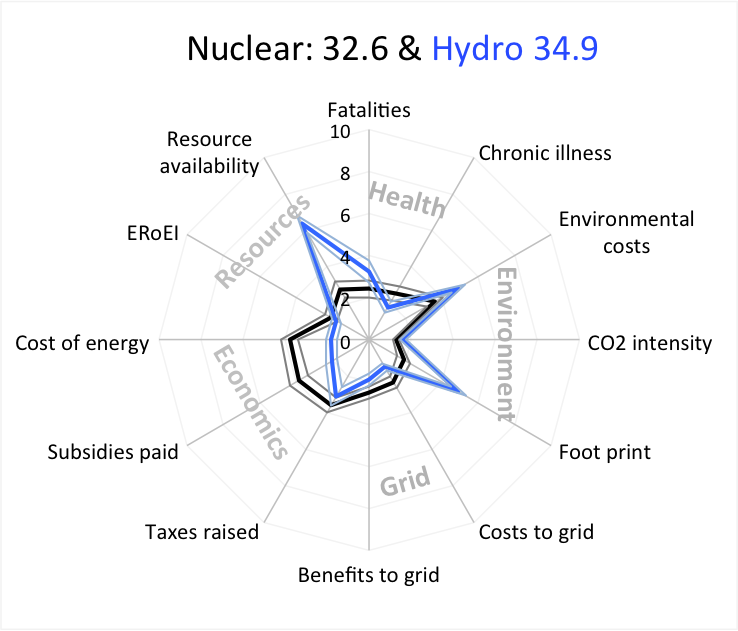
 Figure 2 Spider diagrams for 6 out of 13 technologies surveyed. Researchers developed a 12-axis spider diagram, one axis for each criterion scaled from zero in the center to 10 at the circumference. The ideal electricity source would be represented by a circle with a radius of 1 (the best score in each category). The axes are arranged according to hierarchy. The total mean scores are shown in the panel headers.
Wind and solar photovoltaic systems have similar shapes in the diagram, performing well in Health and Environment and poorly in Resources, Economics and Grid categories. This shape is common to all of the non-combustion, renewable technologies including wave, tidal, and solar thermal energy. The wind and solar spider diagrams are effectively a mirror image of coal.
To sum up, the structured, hierarchical MCDA provided researchers with a means of comparing and quantifying electricity generation technologies. Their survey of 13 technologies sampling expert opinion produced three clear winners, namely nuclear power, combined cycle gas turbine, and hydroelectric power. This should come as no surprise to anyone since these technologies are already widely deployed, known to be among the safest available, and already proven to work together to provide a stable and reliable grid at low cost. What is less easy to explain is why countries like Germany, Switzerland and France have plans to close down their nuclear power stations and replace them with wind and/or solar power that the survey suggests are vastly inferior, at least compared with the present available technologies.
About the authors: Dr. Euan Mearns has a PhD in isotope geochemistry. A former academic, businessman, investor, consultant and energy blogger, he has been employed as a Senior Researcher at ETH Zurich since January 2018. Dr. Didier Sornette is Professor on the Chair of Entrepreneurial Risks at ETH Zurich since 2006 in the department of Management, Technology and Economics, and a professor at the Swiss Finance Institute. Sornette is also associated with both the departments of Physics and of Earth Sciences at ETH Zurich.
Figure 2 Spider diagrams for 6 out of 13 technologies surveyed. Researchers developed a 12-axis spider diagram, one axis for each criterion scaled from zero in the center to 10 at the circumference. The ideal electricity source would be represented by a circle with a radius of 1 (the best score in each category). The axes are arranged according to hierarchy. The total mean scores are shown in the panel headers.
Wind and solar photovoltaic systems have similar shapes in the diagram, performing well in Health and Environment and poorly in Resources, Economics and Grid categories. This shape is common to all of the non-combustion, renewable technologies including wave, tidal, and solar thermal energy. The wind and solar spider diagrams are effectively a mirror image of coal.
To sum up, the structured, hierarchical MCDA provided researchers with a means of comparing and quantifying electricity generation technologies. Their survey of 13 technologies sampling expert opinion produced three clear winners, namely nuclear power, combined cycle gas turbine, and hydroelectric power. This should come as no surprise to anyone since these technologies are already widely deployed, known to be among the safest available, and already proven to work together to provide a stable and reliable grid at low cost. What is less easy to explain is why countries like Germany, Switzerland and France have plans to close down their nuclear power stations and replace them with wind and/or solar power that the survey suggests are vastly inferior, at least compared with the present available technologies.
About the authors: Dr. Euan Mearns has a PhD in isotope geochemistry. A former academic, businessman, investor, consultant and energy blogger, he has been employed as a Senior Researcher at ETH Zurich since January 2018. Dr. Didier Sornette is Professor on the Chair of Entrepreneurial Risks at ETH Zurich since 2006 in the department of Management, Technology and Economics, and a professor at the Swiss Finance Institute. Sornette is also associated with both the departments of Physics and of Earth Sciences at ETH Zurich. The views presented in this article are the author’s own and do not necessarily represent the views of any other organization.
a global affairs media network
Ranking Electricity Supplies

|||||
November 26, 2018
Our electricity-generating systems are in the process of being overhauled. It is very much a case of out with the old and in with the new as the OECD turns its back on coal. The OECD envisions decarbonizing electricity generation using a combination of wind power, solar power, and biomass instead. Focusing on CO2 intensity alone has led to a number of bizarre outcomes such as transporting wood pellets from North America to Europe for industrial-scale power generation; covering hilltops with wind turbines; and fields with solar panels. It is difficult to find an environmental reason in these measures.
Researchers at ETH Zurich wanted to develop a more holistic approach to characterize various generating technologies, but they were confronted with a challenge. How does one compare nuclear power with wind and coal power? This is like comparing apples with barley and potatoes. Multi-criteria decision analysis offered researchers a means of quantifying all of the relevant information for the task. They began with the three pillars of sustainable development:
Table 1 Energy Matters Electricity Technology Survey (EMETS) design showing 5 categories and 12 criteria against which 13 technologies were measured. The example shows how 12 criteria may be applied to coal, but may equally be applied to gas, biomass, etc.
*ERoEI (energy return on energy invested), is a measure of efficiency and considers the full energy production cycle.
In conventional MCDA, stakeholders are often asked to express a preference at the criteria level. The approach researchers adopted was rather different. They sought, instead, to assign scores to each criterion where a 1 = good and a 10 = bad. For example, low fatalities, low CO2 and high availability are all regarded as “good.” Nineteen participants, mainly engineers, physicists, geologists and geophysicists assigned scores, using professional judgement and not preference as a guide. The results, summarized in Figure 1, show 13 technologies in rank order based on total mean scores.
Figure 1 Thirteen electricity technologies arranged in rank order according to their total mean MCDA score selects 3 clear winners - nuclear power, combined cycle gas, and hydroelectric power. Outright losers include all of the new renewable technologies. In the middle, Geothermal and diesel, both niche technologies, and coal - cheap, abundant and controllable - are down-rated on health and environmental grounds.
In order to display results for individual technologies, researchers developed a 12-axis spider diagram (see Figure 2). The spider diagram for nuclear power shows that it scored well on all criteria and that is why it emerged, albeit narrowly, as the top technology. Hydroelectric power displays an uneven distribution on criteria scores. It has performed less well on resource availability, because most good hydroelectric sites are already in use and less well on environmental costs and environmental footprint since hydro reservoirs destroy natural habitats and occupy a substantial area.
The spider diagrams for gas and coal (top right Figure 2) shows how each perform well in the Resources, Economics, and Grid categories and less well in the Health and Environmental categories. Unsurprisingly, coal performs particularly poorly in terms of health and environment. The diagram highlights the similarities and differences between gas and coal. The slightly poor performance of gas in the Health and Environment categories is offset, however, by good performance in the Resources, Economics and Grid categories resulting in a total mean score that is comparable to nuclear and hydroelectric power.
Figure 2 Spider diagrams for 6 out of 13 technologies surveyed. Researchers developed a 12-axis spider diagram, one axis for each criterion scaled from zero in the center to 10 at the circumference. The ideal electricity source would be represented by a circle with a radius of 1 (the best score in each category). The axes are arranged according to hierarchy. The total mean scores are shown in the panel headers.
Wind and solar photovoltaic systems have similar shapes in the diagram, performing well in Health and Environment and poorly in Resources, Economics and Grid categories. This shape is common to all of the non-combustion, renewable technologies including wave, tidal, and solar thermal energy. The wind and solar spider diagrams are effectively a mirror image of coal.
To sum up, the structured, hierarchical MCDA provided researchers with a means of comparing and quantifying electricity generation technologies. Their survey of 13 technologies sampling expert opinion produced three clear winners, namely nuclear power, combined cycle gas turbine, and hydroelectric power. This should come as no surprise to anyone since these technologies are already widely deployed, known to be among the safest available, and already proven to work together to provide a stable and reliable grid at low cost. What is less easy to explain is why countries like Germany, Switzerland and France have plans to close down their nuclear power stations and replace them with wind and/or solar power that the survey suggests are vastly inferior, at least compared with the present available technologies.
About the authors: Dr. Euan Mearns has a PhD in isotope geochemistry. A former academic, businessman, investor, consultant and energy blogger, he has been employed as a Senior Researcher at ETH Zurich since January 2018. Dr. Didier Sornette is Professor on the Chair of Entrepreneurial Risks at ETH Zurich since 2006 in the department of Management, Technology and Economics, and a professor at the Swiss Finance Institute. Sornette is also associated with both the departments of Physics and of Earth Sciences at ETH Zurich.
- Environment
- Economy
- Society
- Class 1: Electricity that is produced when we want to use it.
- Class 2: Electricity that is produced when we do not want to use it.
- Class 3: Electricity that is not produced when we want to use it.
Table 1 Energy Matters Electricity Technology Survey (EMETS) design showing 5 categories and 12 criteria against which 13 technologies were measured. The example shows how 12 criteria may be applied to coal, but may equally be applied to gas, biomass, etc.
*ERoEI (energy return on energy invested), is a measure of efficiency and considers the full energy production cycle.
In conventional MCDA, stakeholders are often asked to express a preference at the criteria level. The approach researchers adopted was rather different. They sought, instead, to assign scores to each criterion where a 1 = good and a 10 = bad. For example, low fatalities, low CO2 and high availability are all regarded as “good.” Nineteen participants, mainly engineers, physicists, geologists and geophysicists assigned scores, using professional judgement and not preference as a guide. The results, summarized in Figure 1, show 13 technologies in rank order based on total mean scores.
Figure 1 Thirteen electricity technologies arranged in rank order according to their total mean MCDA score selects 3 clear winners - nuclear power, combined cycle gas, and hydroelectric power. Outright losers include all of the new renewable technologies. In the middle, Geothermal and diesel, both niche technologies, and coal - cheap, abundant and controllable - are down-rated on health and environmental grounds.
In order to display results for individual technologies, researchers developed a 12-axis spider diagram (see Figure 2). The spider diagram for nuclear power shows that it scored well on all criteria and that is why it emerged, albeit narrowly, as the top technology. Hydroelectric power displays an uneven distribution on criteria scores. It has performed less well on resource availability, because most good hydroelectric sites are already in use and less well on environmental costs and environmental footprint since hydro reservoirs destroy natural habitats and occupy a substantial area.
The spider diagrams for gas and coal (top right Figure 2) shows how each perform well in the Resources, Economics, and Grid categories and less well in the Health and Environmental categories. Unsurprisingly, coal performs particularly poorly in terms of health and environment. The diagram highlights the similarities and differences between gas and coal. The slightly poor performance of gas in the Health and Environment categories is offset, however, by good performance in the Resources, Economics and Grid categories resulting in a total mean score that is comparable to nuclear and hydroelectric power.
Figure 2 Spider diagrams for 6 out of 13 technologies surveyed. Researchers developed a 12-axis spider diagram, one axis for each criterion scaled from zero in the center to 10 at the circumference. The ideal electricity source would be represented by a circle with a radius of 1 (the best score in each category). The axes are arranged according to hierarchy. The total mean scores are shown in the panel headers.
Wind and solar photovoltaic systems have similar shapes in the diagram, performing well in Health and Environment and poorly in Resources, Economics and Grid categories. This shape is common to all of the non-combustion, renewable technologies including wave, tidal, and solar thermal energy. The wind and solar spider diagrams are effectively a mirror image of coal.
To sum up, the structured, hierarchical MCDA provided researchers with a means of comparing and quantifying electricity generation technologies. Their survey of 13 technologies sampling expert opinion produced three clear winners, namely nuclear power, combined cycle gas turbine, and hydroelectric power. This should come as no surprise to anyone since these technologies are already widely deployed, known to be among the safest available, and already proven to work together to provide a stable and reliable grid at low cost. What is less easy to explain is why countries like Germany, Switzerland and France have plans to close down their nuclear power stations and replace them with wind and/or solar power that the survey suggests are vastly inferior, at least compared with the present available technologies.
About the authors: Dr. Euan Mearns has a PhD in isotope geochemistry. A former academic, businessman, investor, consultant and energy blogger, he has been employed as a Senior Researcher at ETH Zurich since January 2018. Dr. Didier Sornette is Professor on the Chair of Entrepreneurial Risks at ETH Zurich since 2006 in the department of Management, Technology and Economics, and a professor at the Swiss Finance Institute. Sornette is also associated with both the departments of Physics and of Earth Sciences at ETH Zurich. The views presented in this article are the author’s own and do not necessarily represent the views of any other organization.
